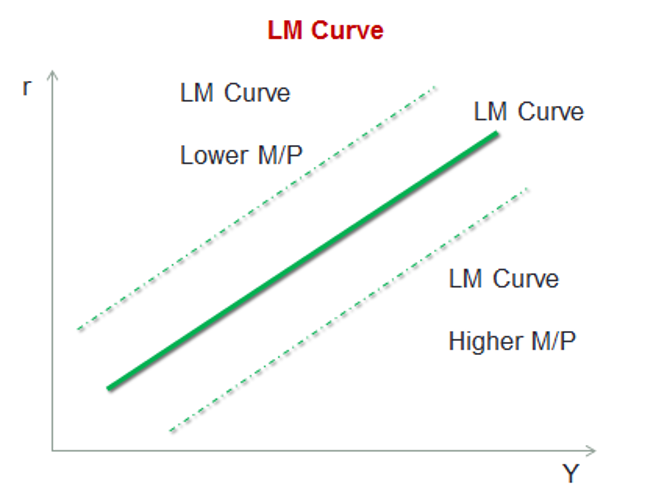
The LM Curve
To plot this curve, we make an assumption that the real money supply is held constant. To derive the LM curve we set:
Real Money Supply = Real Money Demand
According to Quantity of Money Theory:
MV = PY
Here, M is the money supply, V is the velocity of money in transactions (how often money is used to make purchases), P is the price level, and Y is the real GDP or real output. The above equation can be rewritten as follows:
M/P = (1/V)*Y
We can say that real money is directly proportional to output and inversely proportional to interest rate (r). The demand for money is inversely proportional to interest rates because when interest rates are high then we are better off investing money in stocks and bonds reducing our demand for money. When real interest rates increase, the demand for money decreases and when real income increases, the demand for money increases.
Therefore, if we keep the real money supply constant, any increase in demand for real money due to increase in real income must be offset by an increase in interest rates to keep the demand for real money constant. This means that in equilibrium income and real interest rates have a positive relationship provided the real money supply is constant. This relationship is called the LM curve.
This LM curve is at a certain level of real money supply (M/P). If M/P increases, which can happen if nominal money supply increases, or price levels fall, then the LM curve shift to the right, and vice versa.