
Hypothesis Testing with z-statistic
z-statistic is the computed value of the test statistic based on the standard normal distribution.
z-statistic with is calculated as follows:

In the hypothesis test, we compare the z-statistic with the critical z-value at a given level of significance and appropriate degrees of freedom.
Note that when the sample size is large, the population standard deviation (s) can be replaced with sample standard deviation (s).
Example
Widget Inc. is a manufacturer of widgets. The mean thickness of the widget produced by them is 5 inches. However sometimes their machine will defect and the thickness will vary. The quality control team takes a sample of widgets every day to check the quality. If the quality is not acceptable the machine will be sent for maintenance. On one such day the quality control person takes a sample of 25 widgets. The mean thickness of the sample is 5.2 inches. The population standard deviation is known to be 0.1 inches. At a level of significance of 5% identify whether the machine needs to be sent for maintenance.
Step 1: State the hypothesis
The null hypothesis will be that the machine is fine and alternative hypothesis will be that the machine is not fine and should be sent for maintenance.

This is a two-tailed test and null hypothesis will be rejected for value above or below 5.
Step 2: Identify the appropriate test statistic
The distribution is normal, sample size is small, and the population standard deviation is known. Therefore, we will use z-statistic.
Step 3: Specify the significance level
The level of significance is 5%. There is a 5% probability of rejecting a true null hypothesis (Type I error)
Step 4: State the decision rule
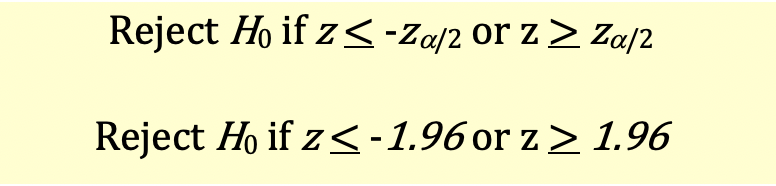
Since it’s a two tailed test, both the values on the left and on the right are rejection regions. The level of significance is 5%, so area of rejection in each tail is 2.5%. We will look for critical value of z(0.025) which is 1.96.
The decision rule will be as follows:
Step 5: Collect the data and calculate the test statistic
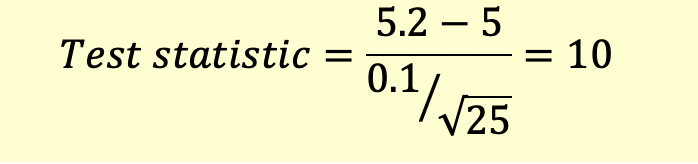
The test statistic will be calculated as follows:
Step 6: Make the statistical decision
The calculated test statistic (10) is greater than critical value (1.96). Therefore, we reject the null hypothesis. The machine should be sent for maintenance.