
How to Calculate Stocks Autocorrelation in Excel
Autocorrelation, also known as serial correlation or lagged correlation, explains the relationship between observations between the same variable over different periods of time. The observations are said to be independent if autocorrelation is zero. Autocorrelation is calculated as a function of mean and variance.
Autocorrelation has application in stock returns. We can calculate autocorrelation in stock returns which can be helpful in equity analysis. For example, let’s say you identify a stock that has exhibited high autocorrelation historically. If you observe that the stock is moving up for the past few days, you can expect the stock movement to match the lagging time series.
Calculation of autocorrelation is similar to calculation of correlation between two time series. The only difference is that while calculating autocorrelation, you use the same time series twice, one original, and the other as the lagged one.
Formula for Calculating Autocorrelation
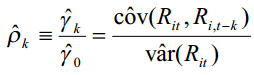
Example: Stock Autocorrelation in Excel
Let’s take a numerical example to learn how we can calculate the autocorrelation for stock returns data in excel. Let’s say we have the following stock returns data with us.
| A | B |
| Day | Returns |
| 1 | |
| 2 | 4% |
| 3 | 3% |
| 4 | -1% |
| 5 | 2% |
| 6 | 4% |
| 7 | 5% |
| 8 | 3% |
| 9 | -1% |
| 10 | 1% |
Step 1: Calculate the Variance
The variance of the series can be calculated using the VAR formula as follows:
=VAR(B2:B10)
= 0.000469
Step 2: Calculate the Covariance
We now need to calculate the k-th lag variance.
For k=1, covariance will be calculated as follows:
=COVAR(B3:B10,B2:B9)
= 0.0001
For k=2, covariance will be calculated as follows:
=COVAR(B4:B10,B2:B8)
=-0.00027
Autocorrelation can now be calculated as follows:
Autocorrelation (k=1) = 0.000469/0.0001 = 4.69
Autocorrelation (k=2) = 0.000469/-0.00027 = -1.737
Autocorrelation is commonly referred to as ACF in formulas.
You can also use the =CORREL() formula in excel to achieve the same results.